MATHTRAK Evaluation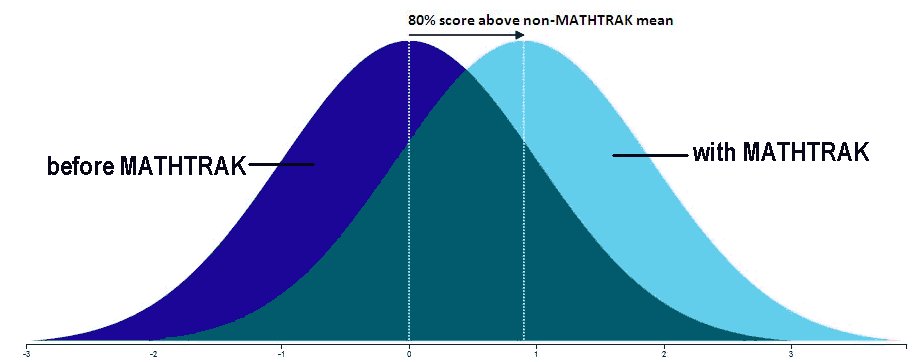 Brief descriptionMATHTRAK is an online Learning Management Tool based on the Australian Mathematics Curriculum. Over a thousand essential skills (called Key Concepts) have been identified in the National Mathematics Curriculum for Years 5 to Year 10. For each of these Key Concepts there is an interactive lesson that teaches the skills involved in the Key Concept and a unique quiz question that tests if the learner has mastered that Key Concept. The great majority of quiz questions are randomly generated so the exact same question will rarely be seen twice. The learner can retry the quiz questions at any time and MATHTRAK keeps track of his/her progress as he/she completes each quiz question.MATHTRAK has been developed by a practising Mathematics teacher in Australia in collaboration with other practising mathematics teachers over several trial schools for more than 10 years. MATHTRAK's impact on student learning has been reviewed in two ways. Click the title for more detail. [Review 1 - User Testimonials] These testimonials are a small list of a large number of positive comments that teachers, students and parents have made about MATHTRAK over the past 10+ years. In many ways these testimonials are the most significant evaluation of MATHTRAK - the comments show how highly users value MATHTRAK in the teaching and learning of mathematics. [Review 2 - Statistical analysis of MATHTRAK's impact] This review was conducted on a cohort of students over 6 courses in three years from years 8 to 10, looking at whether the student's performance on supervised assessment improved with increased use of MATHTRAK. The review looked at:
back Review 1 - User TestimonialsThe best evaluation of MATHTRAK's impact on student learning is to be found in the views of MATHTRAK users. While there is a formal statistical review below on MATHTRAK's impact on student learning it is the users who give the best insight into MATHTRAK's effectiveness. Below is a small selection from the large number of comments made by teachers, students and parents over the years:Teacher Testimonials
Student Testimonials
Parent Testimonials
back Review 2 - Statistical analysis of MATHTRAK's impactAs can be seen from the testimonials above, MATHTRAK users are convinced daily of the impact that it has on learning mathematics. While support for MATHTRAK's approach from those who use it is very significant and important, it is also useful to have some hard data to back up what these users have found to be the case. For this reason, MATHTRAK has conducted an extensive study into its impact on student Mathematics learning in a large Secondary school in Australia.The research was conducted to determine if a student's test performance improved with increased progress (use and success) at MATHTRAK. The study investigated the Mathematics performance on supervised assessment of over 150 students in 6 courses over three years. A sample of one student's data over the three years is shown in Figure 1 below. The "KAPS score" is the student's raw supervised test results on the knowledge and procedures parts of the assessment. So that comparisons of performances over different courses could be made, this mark was converted to a z-score (-3 to 3) which reflects how far away from the cohort's mean his/her score was. A z-score of 0 means that the result is about average for this cohort; a high positive z-score (+3) means that the result was near the top of the cohort and a low negative z-score (-3) means that the result was near the bottom of the cohort. The "MT Progress" (for MATHTRAK Progress) is a score obtained by calculating the student's percentage success with his/her last three attempts on each of the questions for the course at MATHTRAK (and converted to a scale from 0-1). A MT Progress score of 0 means that the student either never attempted the questions or that he/she got none of the last three attempts at the questions correct. A score of 1 means that the student attempted all MATHTRAK questions for the course and got the last three attempts for each question correct. Figure 1 [Discussion - At a glance it can be seen from Figure 1 that in the course M101_15 this student completed MATHTRAK questions with a very low 15% success rate and performed on the supervised Knowledge part of the course assessment at a z-score of 0.33. Whereas in the course M902_14 this same student completed MATHTRAK questions with a reasonable 85% success rate and performed on the supervised Knowledge part of the course assessment at a much improved z-score of 0.88.] The analysis of this data was conducted in three different ways as described below. Analysis 1 - Group Trends within each courseThis analysis looked at trends within each of the 6 courses over the 3 years to see if a relationship existed between a student's MATHTRAK progress and his/her course test results. In other words, this analysis tried to determine for each of the 6 courses, whether progress at MATHTRAK influenced test performance.MethodFor each of the 6 courses, a scatterplot was made of Test performance vs MATHTRAK progress and the line of regression was used to indicate any statistically significant trends. Statistical significance (at 99%) was determined using Student's t. The two variables were determined as follows:Test performance - Supervised knowledge results (KAPS) were calculated as percentages. This is acceptable as comparisons were only being made between those students who sat the same identical assessment. MATHTRAK progress - Over any course each student's progress with MATHTRAK could differ by varying degrees from not at all, through to getting 100% success at MATHTRAK prior to the exam. A student who made no progress with MATHTRAK at all over the course would score a 0 and a student who had attempted every question at least three times and got each right would score a 1. Figure 2 shows the distribution of performances in the course M102_15. Each blue dot represents the test performance and MATHTRAK progress for one student. While there is natural variation between the results from each course, Figure 2 is representative of the trends in all the 6 courses. Figure 2 [Discussion - Figure 2 shows the results for each student's test performance and MATHTRAK progress for the M102_15 course. The graph and statistical analysis shows that students who gained greatest progress with MATHTRAK prior to the exam also gained the better test results. The t-test analysis shows that we can state with 99% confidence that the more progress that a student had with MATHTRAK prior to the exams the better was his/her achievement on the knowledge part of assessment.] Analysis 2 - Individual Trends over the 6 coursesOver the 6 courses students used MATHTRAK by varying degrees prior to the exam. In some courses a student may have made hardly any progress with MATHTRAK, while in other courses the student may have got close to 100% success at MATHTRAK. This variation in MATHTRAK progress enabled an analysis to be made of each individual's MATHTRAK progress and their test results over each of the 6 courses. Therefore, any changes in test results can be attributed to his/her MATHTRAK progress, the only significant change between courses. This analysis looked at each student to determine if there was any relationship between a student's MATHTRAK progress and their knowledge results over the 6 courses. In other words, this analysis tried to determine, for each student over the 6 courses, whether progress at MATHTRAK influenced test performance.MethodFor each student, a scatterplot was made of Test performance vs MATHTRAK progress and the line of regression was used to indicate any trends. The two variables were determined as follows:Test performance - Supervised knowledge results (KAPS) were converted to z-scores (between -3 and 3). This was necessary so that comparison could be made between the six different assessments from the 6 different courses. MATHTRAK progress - The MATHTRAK score was obtained by calculating the student's percentage success in his/her last three attempts with each of the questions for the course at MATHTRAK (and converted to a scale from 0-1). A student who did not use MATHTRAK at all over the course would score a 0 and a student who had attempted every question at least three times and got all right would score a 1. Figure 3 is an example of the distribution of performances over the 6 courses for one student. Each blue dot represents the student's test performance and MATHTRAK progress for each of the 6 courses. Figure 3 [Discussion - Figure 3 shows the results for one student's test performance and MATHTRAK progress over each of the 6 courses. Since these results were for the same student, they provide an insight into any possible effect that improving progress at MATHTRAK might have on test performance. The graph and statistical analysis above show that this student has been inconsistent with his/her use of MATHTRAK over the 6 courses so an indication of the effect of increased MATHTRAK progress can be obtained. While the trend-line is not greatly significant with only 6 data-points it does illustrate, once again, that the more progress that the student has with MATHTRAK prior to exams the better is his/her achievement on the knowledge part of assessment.] Analysis 3 - Aggregated Individual Trends over the 6 coursesThis analysis looked at combining all the results (from Analysis 2 above) for the 150+ students over the 6 courses. Each student's test performances when he/she had little progress with MATHTRAK was compared with his/her test performance when he/she had a lot of progress with MATHTRAK. In other words, over the whole cohort, did a student generally do better on the test when he/she did better on MATHTRAK.Method
Figure 4 summarises the distribution of scores (MATHTRAK progress,Test achievement) per quartile of MATHTRAK progress for all students. It also includes the effect size comparing test performance of those in the lower 25% of MATHTRAK progress compared to those in the upper 25% of MATHTRAK progress.
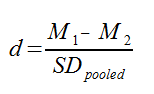
Figure 4 Figure 5 shows the graph of means of z-scores for each quartile from the table in Figure 4. [Discussion - Figures 4 and 5 show the average of the results per quartile for the 150+ individual student's test performance and MATHTRAK progress over each of the 6 courses. They compare each student's performance on tests with their success on MATHTRAK for each of the six courses. The analysis shows that generally, as a student gains greater success at MATHTRAK then his/her success with knowledge assessment improves. In other words, Figures 4 and 5 confirm statistically what MATHTRAK users know (as demonstrated by their testimonials) - that introducing MATHTRAK to the mathematics classroom results in statistically significant improvement in test performance with an Effect Size of 0.88. An effect size of this magnitude means that when the students gained success with MATHTRAK on a regular basis, approximately 80% of these students scored above the assessment mean when they didn't use MATHTRAK regularly. This is equivalent to saying that 30% of the students who would have been below the course mean when using MATHTRAK irregularly, moved to scoring above that mean when using MATHTRAK regularly. Click here for an explanation of Effect Size. ] [Contact] MATHTRAK to find out how you can access this highly effective tool with proven impact. back Effect Size and John HattieIn Visible Learning John Hattie suggests that an effect size of -0.10 -> 0.16 is what a student would learn if not in a classroom; an effect size of 0.16 -> 0.40 would be the effect of a normal classroom with an effect size of 0.40 being about the average effect we expect from a year's schooling. Therefore, he asserts, interventions of 0.40 and above are the ones that will truly improve student achievement.Determining Effect Size using Cohen's dCohen’s d is a measure of the distance between two means, measured in standard deviations. The formula used to calculate the Cohen’s d looks like this:
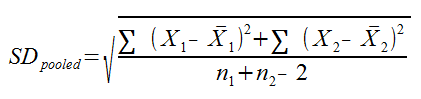
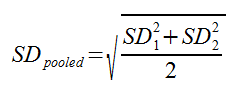
Where M1 and M2 are the means for the 1st and 4th quartiles, and SDpooled is the pooled standard deviation for the quartiles. SDpooled is properly calculated using this formula: In practice, though, you don’t necessarily have all this raw data, and you can typically use this much simpler formula:
An explanation of Effect Size and how it can be interpreted can be found here with an interesting interactive animation here. | |||||||||||||||||||||